Clinical Quality
Our Quality Measures
Hand Hygiene and Hospital-Acquired Infections
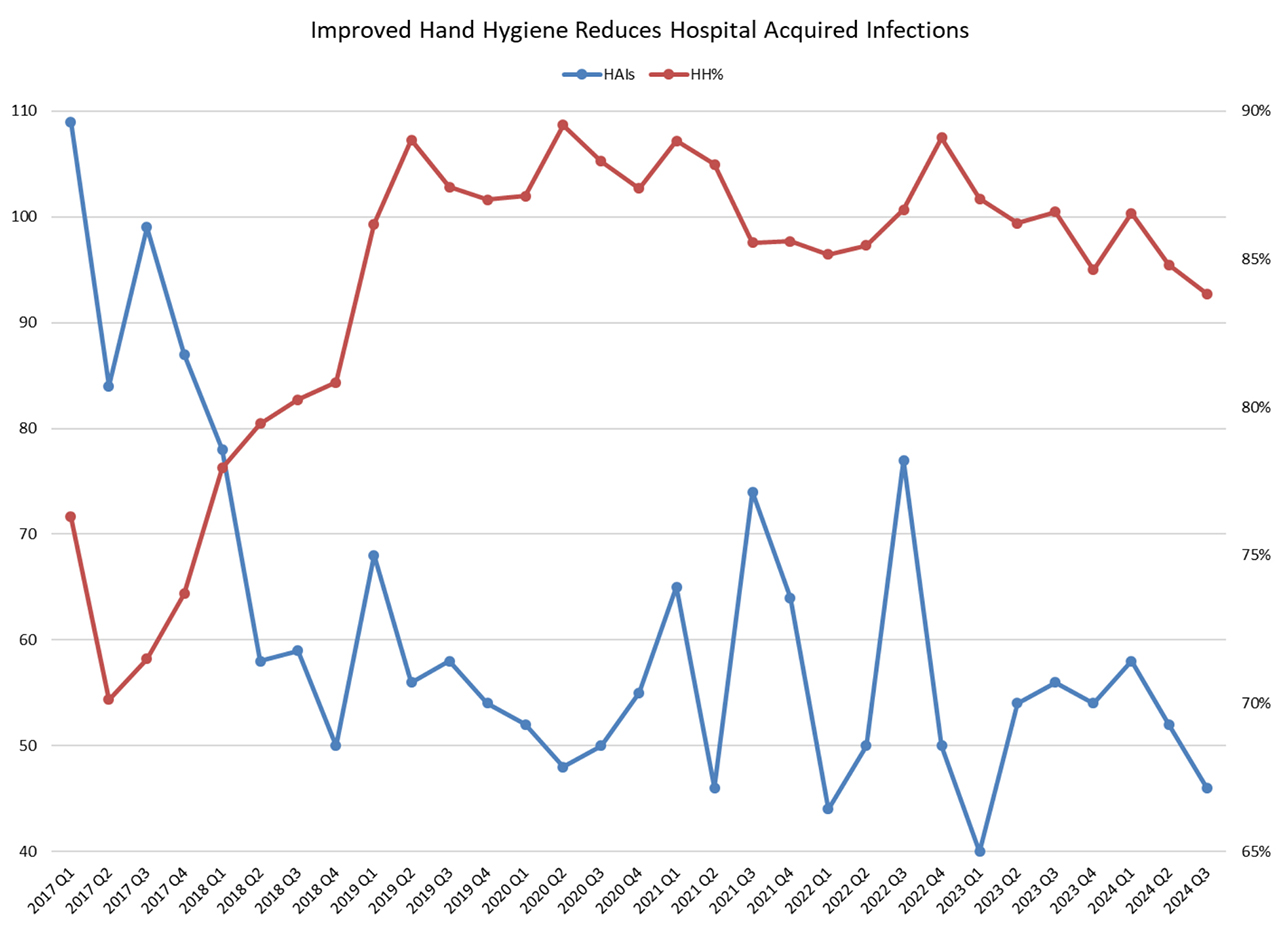
A robust hand hygiene program (HH) is the major driver for eliminating hospital-acquired infections (HAI). HAIs include infections related to central lines and urinary catheters, Clostridium difficile, and surgical site infections. UMMC made reduction of HAIs a primary quality improvement goal, and as shown in the graphic (access the graph in the link below) these have fallen by over 60% in the past four years. The sustained improvement in HH in this graph, combined with standardizing other infection prevention practices are the mainstays of this program as we drive to achieve zero HAIs. Of note, the COVID pandemic created instability in HAI rates in 2020 and 2021.

| Quarter | Hospital-Acquired Infections | Hand Hygiene Rate |
| 2024 Q4 | 44 | 84.7% |
| 2025 Q1 | 55 | 83.6% |
30-Day Mortality
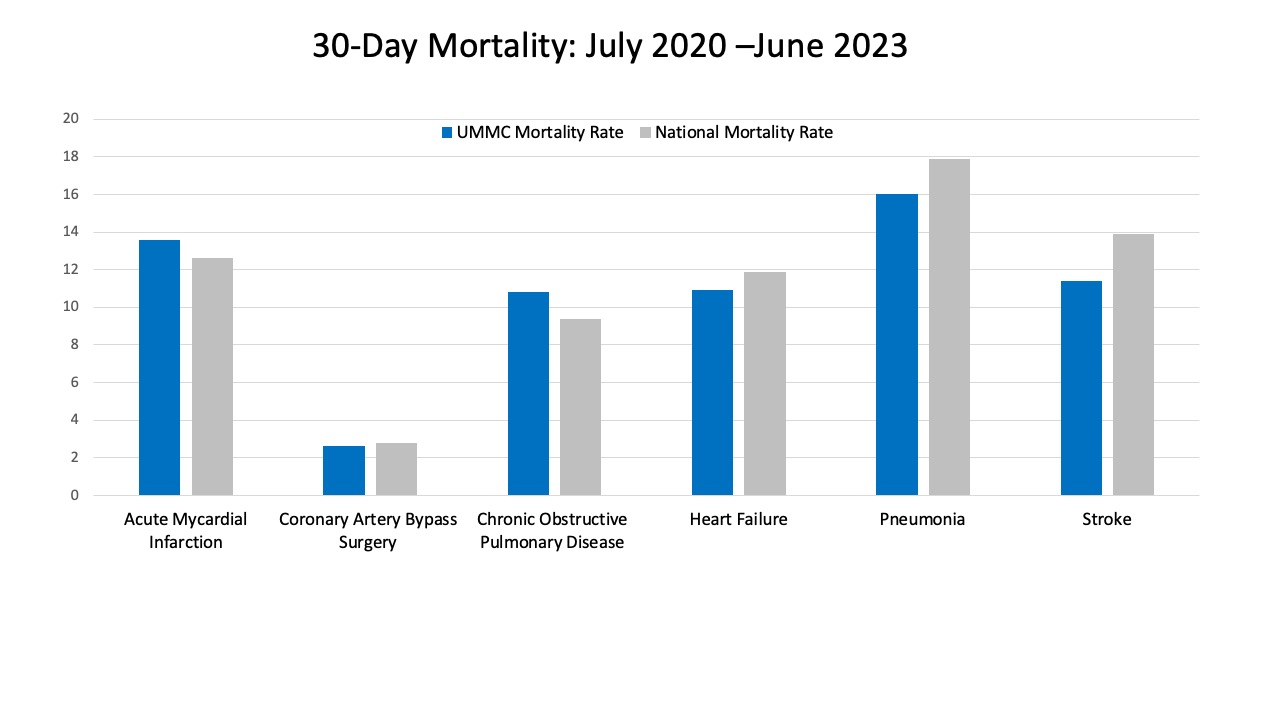
The 30-day mortality measure shows the rate at which patients die of any cause within 30 days of being admitted to the hospital. Mortality rates reflect major aspects of care that affect patient outcomes, such as preventing and responding to complications, providing timely care, and adhering to safety protocols. UMMC continues to improve the 30-day mortality rate and is below the national average for coronary artery bypass surgery, heart failure, pneumonia and stroke.

Patient Experience
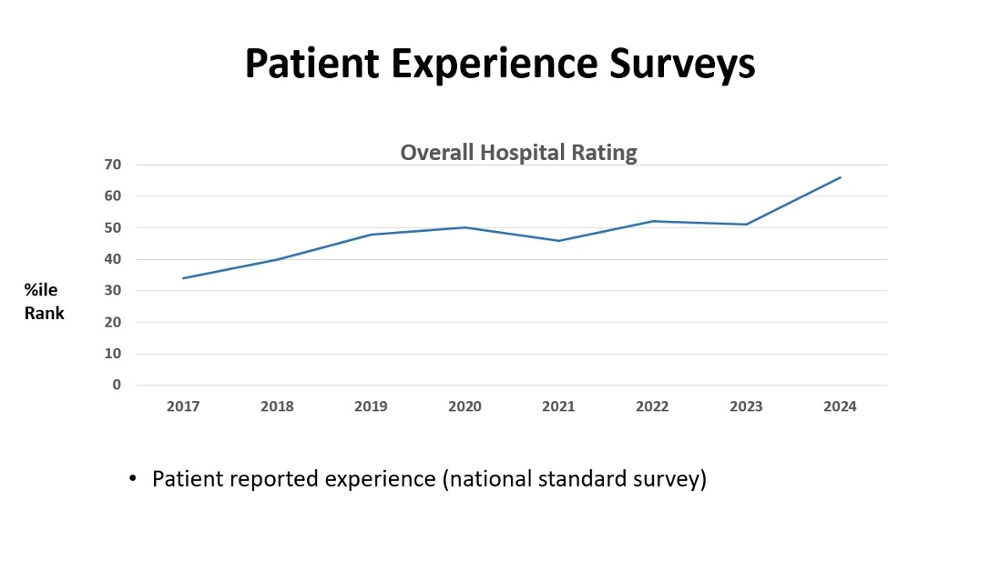
All hospitals are required to survey their discharged patients using a national standardized survey administered by independent vendors. There are 10 domains to the hospital survey primarily around communication with patients and family. The data are published on Hospital Compare and used in both reputation and pay-for-performance programs. UMMC scorecard reports the overall hospital rating by patients as our main patient experience measure: this has steadily increased over the past 5 years and is now better than half all hospitals in the USA.


